How Long Can A Tesla Battery Last?
Your Tesla battery does not have a single “lasts X years” number, because what you feel as range depends on degradation, temperature, and charging habits. The spec that matters most is capacity retention, usually tracked as rated range or Battery Health. We’ll walk through how lifespan and degradation differ, what changes around 50k to 200k miles, and how to check health in the car before you pay for any replacement.
Tesla battery life is best predicted by capacity retention and degradation, not a fixed years-only lifespan. Many owners see noticeable range loss over higher-mileage ownership, often with slow aging and faster wear from frequent DC fast charging and hot/cold extremes. Use the Tesla app and actual rated-range changes to track health, then compare against warranty mileage terms.
How Long Can A Tesla Battery Last?
Recommended Products



Tesla battery “life” is best treated as two different numbers: how long it lasts before it becomes unreliable or unsafe, and how long it retains enough capacity for the range you expect. In practical terms, most owners judge longevity by capacity retention (range staying “close enough”) plus the pack’s cycle life (how many full equivalent charges it can handle before degradation accelerates).
Lifespan means time until the pack reaches a condition where you replace it, often driven by capacity loss, warranty coverage, or a change in your driving needs. Degradation is the slow loss of usable lithium inventory, usually expressed as percent capacity remaining and seen as declining range at the same speed and temperature. Cycle life is the count of charge and discharge events the pack can tolerate while staying within a defined degradation threshold, but cycle counts depend heavily on depth of discharge and charging behavior.
Capacity Retention And Usable Range
Usable range drops as the battery’s “available” capacity drops, even if the car still shows a full charge. Weather and driving style can make range swing year to year, so range trends only make sense when you compare similar trips and temperatures over time. A key trade-off is that higher state of charge (staying near 100%) and frequent high-power charging generally increase stress, even if the car’s battery management system limits damage.
Capacity retention is the cleanest long-term metric, but you usually see it indirectly through the car’s reported energy use and estimated range. Owners can reduce hype by tracking a consistent baseline, for example one or two repeating routes, charged to the same target, using the same driving mode. When the baseline energy consumption rises for the same route and conditions, that usually signals more than temporary temperature effects.
Why Miles And Years Both Matter
Battery aging is a mix of calendar aging (time and temperature exposure) and usage aging (how hard the pack is worked). High-mileage drivers may reach wear sooner through cumulative charge and discharge, while low-mileage drivers can still see meaningful degradation if the pack spends long periods at high or very low temperatures. Storage habits matter, because a parked car at high state of charge is still aging the cells.
Warranty terms are a boundary condition, not a longevity promise. Tesla warranty coverage and replacement decisions depend on both time and mileage, and those terms vary by vehicle and region, so check the warranty booklet or your car’s warranty screen for the exact conditions that apply to your specific pack.
What To Look For To Judge Battery Health
| Health signal | What it usually means | Practical action |
|---|---|---|
| Slower fast charging | Higher stress or temperature management limits | Compare when charging (temperature, target SOC), then schedule service if persistent |
| Higher energy use for same route | Usable capacity loss or efficiency changes | Track several baselines before concluding; verify tire pressure and driving mode |
| Frequent warnings | Potential thermal or cell monitoring issue | Stop pushing charging repeatedly, and get the system inspected |
Tesla packs are designed to manage cell stress, so longevity is usually about how you treat the pack day to day: charging targets, time spent at high state of charge, and how often you request maximum power on hot or cold days. A realistic expectation is that you will likely see gradual capacity loss over years, and “how long” depends more on those patterns than on a single number of miles.
Battery life planning should include your replacement decision: if your range requirements are flexible, you can live with more degradation for longer; if they are not, you may replace sooner after a noticeable threshold is crossed. Align your replacement timeline with warranty boundaries and your actual range needs.
Model Differences In Battery Aging
Recommended Products


Battery aging speed can diverge between Tesla Model 3/Y and Model S/X because each line tends to experience different thermal and driving duty cycles. The same chemistry can age differently when one vehicle more often runs at higher sustained loads, sees more aggressive charging sessions, or holds different operating temperatures over time.
Model 3 and Model Y owners often drive fewer high-power thermal events per trip, since typical daily use is lower sustained load. Model S and Model X commonly attract drivers who may do more frequent high-demand acceleration, higher-speed cruising, or longer highway segments under heavier loads, which can increase heat exposure and drivetrain-battery coupling. Heat is the main accelerator for lithium-ion degradation mechanisms, so usage patterns that raise average cell temperature usually shorten calendar and cycle life.
Driving profile is the other big lever. Frequent high state-of-charge arrivals, repeated full or near-full topping up, and fast charging sessions while the pack is warm can stack stress. Regenerative braking strength and the size of energy swings also matter, because high cycling depth means the cells spend more time farther from equilibrium, which increases degradation per mile.
| Factor | Model 3/Y pattern (typical) | Model S/X pattern (typical) | What it does to aging |
|---|---|---|---|
| Thermal duty cycle | More commuter-style driving | More sustained high load or higher speed usage | Higher cell temperature increases wear |
| Charge behavior | More home charging, variable public fast charging | More frequent DC fast charging on trips | Fast charging stress rises when the pack is warm |
| Energy swing depth | Often moderate daily SoC windows | Can involve larger day-to-day energy changes | Deeper cycling increases capacity fade per mile |
| Power electronics load | Lower sustained drivetrain demand in typical use | Higher sustained demand in some driving styles | More heat in the whole system, not just cells |
Where buyers get misled is assuming “same battery” means “same aging curve.” Tesla pack behavior also depends on how often the battery is conditioned and how energy is routed during acceleration, regen, and charging. Even with similar chemistry, the practical stress profile comes from what you do week after week.
What Tesla’s battery health view measures is capacity-related degradation and usable performance as the pack ages, plus changes that show up under real load and charging conditions. Readers should treat the displayed “battery health” or range estimates as relative indicators, since the value depends on recent driving, temperature history, and how the car has been used since the last calibration-like events.
Model 3/Y and Model S/X both age, but the direction and speed of that aging usually tracks thermal stress and cycling patterns more than model badge alone.
Mileage Milestones And Range Loss
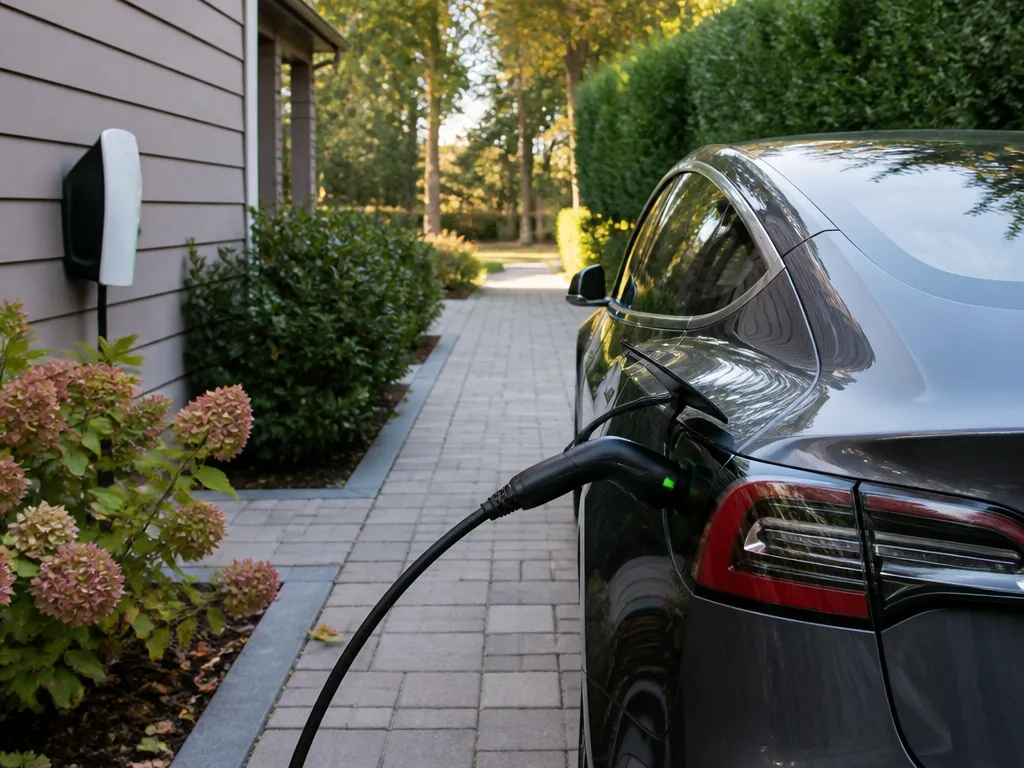
Battery aging shows up as reduced usable capacity, and that translates into fewer miles per charge. The most practical way to estimate “how long it lasts” is to track range versus odometer at 50,000-mile milestones, then convert battery health readings into an approximate range-retention curve. Exact degradation numbers vary by climate, charging habits, and driving load, so treat any mileage table as a template until you plug in conservative, verified estimates.
Capacity Retention Tables By 50k-mile Steps
Build a two-track view: (1) capacity health from the car’s battery report, and (2) real-world range at a consistent test routine (same temperature, similar speed, similar state of charge window). When you later compare cars, keep the “test routine” consistent, because highway speed and winter conditioning can swing estimated range by more than gradual battery loss.
Use the tables below as placeholders for conservative, cited estimates. Insert your verified capacity-retention percentages once you confirm a reputable source that reports degradation by mileage for the specific model generation and chemistry.
| Odometer milestone | Model 3 / Y capacity retention (placeholder) | Approx usable range retention |
|---|---|---|
| 0 to 50k mi | Insert % (conservative) | ≈ same % (minor variance due to efficiency) |
| 50k mi | Insert % (conservative) | ≈ same % |
| 100k mi | Insert % (conservative) | ≈ same % |
| 150k mi | Insert % (conservative) | ≈ same % |
| 200k mi | Insert % (conservative) | ≈ same % |
| Odometer milestone | Model S / X capacity retention (placeholder) | Approx usable range retention |
|---|---|---|
| 0 to 50k mi | Insert % (conservative) | ≈ same % (minor variance due to efficiency) |
| 50k mi | Insert % (conservative) | ≈ same % |
| 100k mi | Insert % (conservative) | ≈ same % |
| 150k mi | Insert % (conservative) | ≈ same % |
| 200k mi | Insert % (conservative) | ≈ same % |
How To Convert Health % Into Range Loss
Capacity retention is a better predictor of long-term range than short-term “consumption” because losses grow slowly. Convert by using a simple proportional model: estimated range equals original rated range multiplied by capacity retention, then adjust for efficiency changes you can measure.
Conservative rule for planning: if your calculated capacity retention implies only a small drop, verify with actual “miles per charge” data under the same test routine. If the test routine cannot be repeated, widen your uncertainty buffer.
Uncertainty Handling When Data Conflicts
When published degradation by mileage differs across sources, assume the spread comes from different measurement methods, battery revisions, and usage patterns. Replace single-point tables with ranges and explicitly flag that your mileage milestones are planning tools, not guarantees.
In practice, treat mileage-to-health as a curve with a range of outcomes. Use the lower end of the curve for buying decisions and the midpoint only after you have your own vehicle’s baseline data over multiple seasons.
Warranty Coverage Limits Explained
Tesla warranty coverage for the battery and drive unit is defined by both time and an odometer limit, and the exact terms vary by model, build date, and jurisdiction. Before you rely on any printed figure, verify the VIN-specific warranty shown in your Tesla account, since exact durations and mileage caps can change across years and regions.
Battery Pack Vs Drive Unit: What Each Warranty Usually Targets
Tesla typically treats the high-voltage battery pack warranty separately from the drive unit warranty. The battery warranty usually centers on repair or replacement if the battery develops a defect or fails to maintain a stated level of capacity, while the drive unit warranty focuses on drivetrain components that stop working as designed.
Because warranty wording is legal and VIN-specific, some cars may also have additional coverage layers from region-specific programs or purchase timing. For practical shopping and planning, treat the battery warranty as your “capacity and defects” safety net, and the drive unit warranty as your “powertrain mechanical/electrical failure” safety net.
Battery coverage typically addresses two practical outcomes: (1) hardware defects that cause a failure, and (2) performance issues tied to capacity retention targets (for example, rapid capacity loss compared with expected aging). Normal wear is generally excluded, meaning gradual degradation from everyday use is usually not treated as a warranty defect.
In practice, warranty disputes often come down to measurements and interpretation. Capacity reporting in the vehicle, service diagnostics, and the specific warranty threshold in your owner documents determine whether Tesla treats the result as a defect or normal aging.
| What you’re checking | Warranty bucket | What “good” evidence looks like | What’s commonly excluded |
|---|---|---|---|
| Battery pack hardware fault | Battery warranty | Service codes, diagnostic findings, repeated failures | Damage from impact, improper installation, physical abuse |
| Capacity loss beyond threshold | Battery warranty (capacity retention terms) | Vehicle-reported health metrics aligned with the warranty measurement method | Normal degradation over time and mileage |
| Drive unit failure | Drive unit warranty | Fault logs and confirmed component-level issues | Wear items or damage unrelated to manufacturing defects |
For example, a car that loses usable range faster than peers may still be outside warranty if the measured capacity loss falls within expected aging. Another example is a battery that shows reduced performance due to thermal history or external damage, which may shift the case away from warranty coverage.
Practical takeaway: warranty coverage tells you what Tesla will likely replace or repair, but it does not reset or pause battery aging. For any battery health concern, document symptoms, gather the latest vehicle health readouts, and schedule service so Tesla can compare your measured results against the exact VIN-specific thresholds.
Charging Habits That Shorten Life
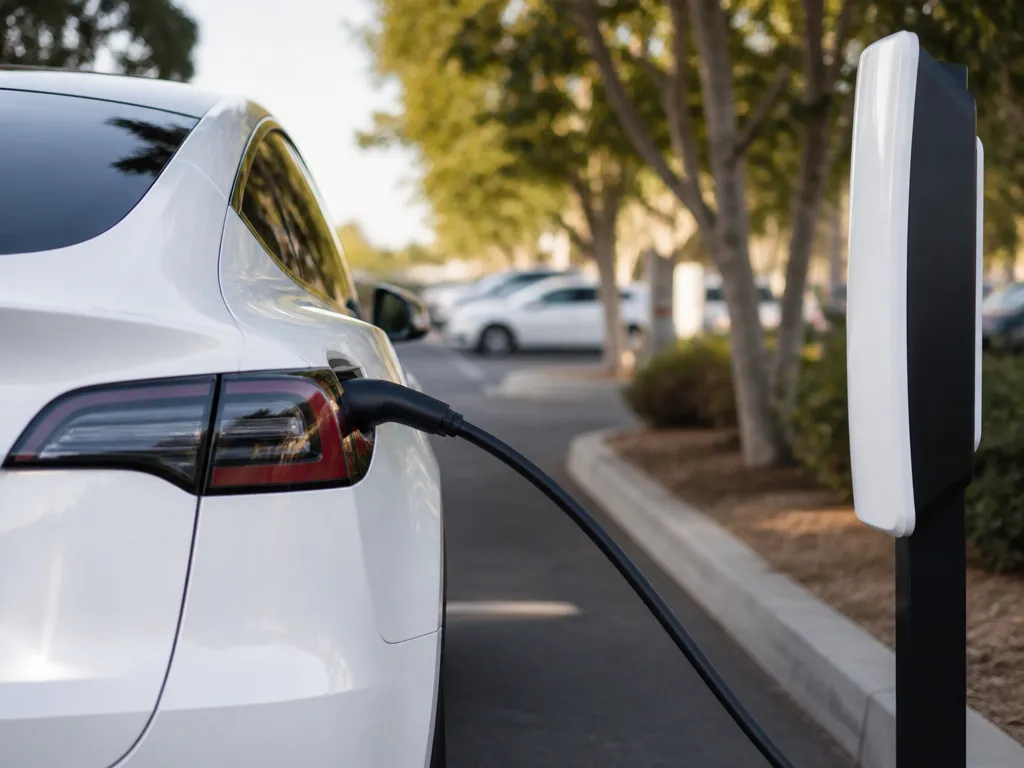
Charging habits that keep the pack hot, hold it near full charge for long periods, or repeat very high power charging often drive faster capacity fade. Lithium-ion cells age from both time at high state of charge and stress from high temperature, so the biggest wins come from limiting heat and avoiding long stays at the top.
State-of-charge Targets That Reduce Stress
For daily use, a practical target is to keep the battery mostly in the middle of its range. Many owners see improved longevity when they charge to a “ready” level for the next trip, then avoid repeated topping off to 100% when they do not need it.
For example, planning around departure time helps because you can charge closer to when you leave, instead of leaving the car at a high charge level for hours. Treat 100% as an occasional option for longer trips, since it increases time spent near the top of the pack where aging accelerates.
Dc Fast Charging: How Often And When
DC fast charging adds stress because it pushes high power through the pack and can raise temperature, especially during repeated sessions. Use fast charging when you need it, but schedule slower charging when it is convenient and you have time.
In practice, the safest habit is to avoid stacking multiple fast-charge sessions back to back when the battery is already warm. Cooler packs take charging power more comfortably, and heat is a major degradation driver.
| Scenario | What to watch | Longevity-friendly adjustment |
|---|---|---|
| Frequent route with DC fast chargers | Battery temperature and how quickly the pack warms | Mix in slower charging when possible between sessions |
| Last-minute DC fast charging before a long drive | High power immediately after charging | Charge enough to start, then drive steadily instead of rapid recharging loops |
Cold And Hot Charging: Why Temperature Control Matters
Cold charging can increase internal resistance and force the battery to work harder to accept charge, while hot charging speeds chemical aging. For longevity, prioritize charging when the pack is near normal operating temperature, and let battery preconditioning do its job when you have it available.
For instance, repeatedly plugging in on an extreme cold morning and immediately requesting fast power can increase stress, while doing the same after the pack warms can be gentler. Heat management during charging also matters because even short periods at elevated temperature can leave a lasting mark on capacity.
Storage Guidance For Weeks To Months
Leaving a pack at very high or very low state of charge for long periods increases the pressure on the cells over time. Storage should be planned around a moderate state of charge and stable temperatures, since both extremes and temperature swings accelerate aging.
For longer storage, a battery that sits plugged in can keep the car in a cycling or balancing routine depending on settings, so set a storage-friendly charge level first and then let it rest. If the vehicle or app offers a storage or “leave for a while” mode, use it rather than improvising with repeated top-offs.
Safety note: If the pack area is unusually hot during or after charging, or you see messages about charging limits, stop and investigate. Repeated high heat during charging can indicate a fault in the charger, cable, or battery system, and continued charging is the wrong trade-off.
Heat, Safety, And Swelling Signs
Battery issues that involve heat can escalate quickly, so treat any warning indicator or unusual odor as a safety event, not a “maintenance item.” Swelling, hissing, visible deformation, or repeated overheating after a charge are strong reasons to stop using the pack and arrange inspection.
Thermal management in an EV depends on sensors, coolant flow, and protective limits that reduce charging power when temperatures are out of range. Heat exposure drives faster aging and can stress the battery materials, but the more urgent risk is hardware damage that can progress to venting if a fault is severe. Cold soaking also matters, since charging at low temperatures can push the system to heat the pack, increasing time spent in a warm-up state.
What To Watch For In The Car Vs. The Battery Case
In-car alerts are the first layer of evidence because they come from temperature, voltage, current, and insulation monitoring. Follow the exact prompt on-screen and from the manual, because the car may limit power or charging to reduce thermal stress. Common cues include messages about charging being limited, reduced power, or a fault requiring service.
Physical inspection is still useful when you have access to the pack area, but it also has clear limits. Swelling may show as bulging panels, gaps where there should be none, or uneven underbody shape. A sharp sweet, chemical, or “solvent-like” smell during or after charging can indicate electrolyte or protective material breakdown, and hissing or popping noises can indicate active venting.
What To Do When Heat Or Damage Appears
Safe handling is about preventing secondary risks. Do not use makeshift chargers, do not swap connectors, and do not try to “fix” cooling issues by adding fluids yourself. Avoid parking in extreme heat or direct sun while awaiting service, since high ambient temperature can raise pack temperature even when charging is stopped.
| Sign | What it often indicates | Practical action |
|---|---|---|
| Repeated charging limits or fault alerts | Cooling, sensing, or pack stress beyond limits | Stop the session, unplug safely, plan service |
| Strong odor, hissing, smoke | Possible venting or material breakdown | Stop charging, evacuate area if needed, call service/emergency per guidance |
| Visible bulging or panel deformation | Possible swelling or structural damage | Do not drive or charge, arrange inspection urgently |
Test Health And Estimate Remaining Life
Real-life battery aging is best tracked with measurements you can repeat, not with a single health screen. Compare your car’s rated range (from the Energy app and the vehicle UI) to your measured energy use in kWh per mile (or km), then watch how that gap changes over time. Use the Tesla app Battery Health metrics only as a trend signal, because they can be affected by temperature, charge limits, and recent driving conditions.
Build A Usable “Health Dataset”
Start with a baseline that you can reproduce. Record average consumption (kWh per mile or per km), outside temperature, trip length mix (highway vs city), and your charging target (for example, a consistent daily charge limit). Keep notes for at least 8 to 12 weeks so weather and driving style average out.
Track range and energy together so you can convert “miles of range” into a capacity-style estimate. A practical way is: measure energy per distance from recent trips, then estimate how many kWh your rated range implies using your displayed rated efficiency. When capacity fades, you typically see higher kWh per mile for the same conditions, and the rated range drop lags or leads depending on how Tesla is presenting efficiency.
Use Tesla App Health Metrics Carefully
Tesla’s Battery Health view can help you spot an accelerating or stabilizing trend, but it is not a full engineering measurement. Battery management systems estimate capacity using factors you can influence, such as how often you charge near 100%, how long the pack sits at high state of charge, and ambient temperature. Battery preconditioning, recent driving load, and what you call “typical” can shift the reported numbers.
In practice, use Tesla app metrics the way you would use a thermometer, not a scale. A single reading is noisy, so focus on direction and slope across multiple months. If Battery Health appears stable while your kWh per mile rises, verify measurement method before concluding anything about deterioration.
Confirm With Third-party Tools, Cautiously
Third-party battery health apps and OBD-style readers can be useful, but you need to verify what they measure. Confirm whether the tool is estimating capacity, estimating state of health (SOH) from voltage and current, or just reporting recent performance. If the tool only logs transient values, it may look precise while being too sensitive to temperature and driving.
When using any tool, verify that it can export time-stamped logs so you can plot trends yourself. Battery aging is a slow process, so the best tool is the one that lets you compare the same metric over many weeks.
Spot Accelerating Loss
Battery fade is usually gradual, but it can feel like “it got worse fast” when you change habits (for example, higher charge limits, more frequent DC fast charging, or harsher winter driving). Accelerating loss is most credible when you see a consistent upward slope in kWh per mile plus a consistent downward drift in displayed rated range efficiency across months. Sudden single-week changes usually point to weather, routes, or measurement inconsistency.
Rule of thumb for trend testing: if your monthly average kWh per mile increases by roughly the same amount for 3 consecutive months while your driving mix and charge settings stay similar, treat it as a real degradation signal and keep testing before you assume replacement.
| Signal | What it often means | What to check next |
|---|---|---|
| kWh per mile rises steadily | Likely capacity or usable-energy loss, or consistent efficiency loss | Verify routes, speeds, tire pressure, and charge limit stability |
| Rated range drops faster than consumption | Presentation or efficiency estimate changes | Confirm temperature and “rated” display conditions |
| Battery Health metric shifts but consumption stays flat | Reporting variance or test-condition effects | Re-run with repeated routes and similar seasonal conditions |
Replacement And Cost Tradeoffs
Battery replacement is usually driven by whether the pack is still covered and whether the diagnosed loss of capacity or power limits is repairable. Tesla service decisions typically hinge on diagnostic results, warranty eligibility, and whether a part-level fix can resolve the fault without replacing the entire pack.
Refurbishment or “partial repair” can be a good fit when symptoms point to a specific component like a sensor, contactor, cooling-related issue, or inverter-side problem. Full-pack replacement becomes more likely when the battery management system reports significant cell-level imbalance, repeated thermal events, or a condition that indicates broad pack degradation rather than a single failed subassembly.
What Drives The Quote Accuracy
Accurate quotes depend on the difference between “what you notice” and “what the car measured.” A service center may need a full diagnostic scan to identify fault codes, cell group behavior, thermal readings, and whether the issue is consistent with aging or with a specific hardware failure.
Warranty status changes the outcome fast, even when the underlying issue is the same. A pack that is still within coverage can shift costs from “customer pays parts and labor” to “service under terms,” while an out-of-coverage vehicle usually requires customer-approved parts and labor for whatever is found during diagnostics.
| Decision input | Why it changes the outcome | What to ask the service center |
|---|---|---|
| Diagnostic findings | Identifies whether the problem is localized or pack-wide | Which codes or measured results point to cell degradation versus a component fault? |
| Warranty and coverage status | Can determine whether labor and parts are covered | Is the pack covered for this failure mode, and what exact coverage applies? |
| Labor effort scope | Pack replacement has higher labor time than component-level repair | Is this a pack replacement or a targeted repair, and what work is included? |
| Parts sourcing | Availability can affect scheduling and the final invoice | Are parts in stock, and is there any substitute or backorder risk? |
| Safety-related findings | Damage history can require additional checks or actions | Was there any thermal event, leakage, or physical damage that changes the scope? |
Questions To Ask Before Approving Service
Before you authorize anything, request an itemized estimate that separates diagnostics, parts, labor, and any follow-up testing. A clear quote should state the suspected cause, the intended fix, and the success criteria, meaning what measurement or behavior should return to normal after the work.
In practice, ask for the “decision tree” the technician used: what result would lead to component repair and what result would lead to pack replacement. Also ask how the car will be verified afterward, for example whether logs will show improved thermal stability or whether charging and power limits should normalize.
Resale Impact Versus Repair Timing
Resale usually depends on how the battery issue is documented. A properly performed warranty repair or a documented, official pack replacement can reassure buyers because it creates a clear maintenance history, while an undocumented repair can lower confidence.
Repair timing is a trade-off between avoiding long-term stress on the system and keeping the car operable. If the car shows repeated thermal warning behavior or frequent power limiting, delaying can compound wear and complicate future diagnostics, making it harder to sell quickly for a fair value.
Quick Summary
Tesla battery “life” does not come down to a single fixed number, because real-world range depends on capacity retention, temperature, and how you charge. The article stresses that capacity retention, tracked through rated range or the car’s Battery Health, is the best long-term metric rather than years alone. It also notes that noticeable range loss often shows up with higher mileage, while aging is typically slower and faster wear can come from frequent DC fast charging plus hot or cold extremes. Best next action is to focus on tracking capacity retention trends using consistent routes and charge targets.
The article explains that “lifespan” and “degradation” are different things, and it separates time-based calendar aging from usage stress, including cycle life and depth of discharge. It warns not to confuse time with cycles, and it adds that fast charging more often usually accelerates degradation compared with home charging. It also says range swings can be caused by weather and driving style, so compare similar trips and temperatures. Check health before assuming replacement, using displayed Battery Health and repeat baseline range, and verify warranty limits for your exact VIN and model because warranty is mileage-limited and varies.
Frequently Asked Questions
How Long Can A Tesla Battery Last In Years?
Your Tesla battery is typically designed for many years, but the exact “lifespan” depends on how you charge, drive, and keep it within temperature limits. A good way to estimate remaining life is to check for the battery’s health or warranty status in your vehicle’s service documentation, since specific degradation rates vary by model and use.
What Is The Difference Between Tesla Battery Lifetime And Cycle Life?
Battery lifetime is how long it keeps working to your acceptable power and range, while cycle life is how many charge-discharge cycles it can complete before noticeable capacity loss. If you want a more predictable comparison, focus on the warranty terms and any published degradation and test conditions for your specific battery pack, because “cycles” can mean different things in different test methods.
Can I Use Any Charger, And Will Charging Speed Affect How Long A Tesla Battery Lasts?
You should only use chargers that match your vehicle’s charging standards and the connector type, and follow Tesla’s guidance for recommended charging behavior. In general, charging habits and temperature matter more than chasing maximum charging speed, because frequent high heat during fast charging can accelerate long-term wear.
What Heat Level Is Risky For Lithium Batteries During Charging?
Charging a lithium battery while it is too hot can shorten life and increase safety risk, and Tesla vehicles use internal thermal management to limit this. If your cabin or pack is hot (for example after sun exposure), let the vehicle regulate temperature before charging at higher rates, and never charge a pack that smells, leaks, or looks swollen or damaged.
How Do I Know When It Is Time To Replace A Tesla Battery, And What Buying Mistakes Should I Avoid?
Replacement is usually based on performance and diagnostic results, not just age, so check service reports for health indicators and range loss that is outside normal expectations. A common buying mistake is paying for “battery health” claims from unverified vendors, so stick to Tesla-supported diagnostics and be cautious with third-party compatibility claims for replacements or charge accessories.

- 10 Best Battery For Generator Battery Safety System 2026 - October 12, 2026
- 10 Best Battery For Generator Battery Safety Option 2026 - October 12, 2026
- 10 Best Battery For Generator Battery Safety 2026 - October 12, 2026