How Long Do Solar Panel Batteries Last?
Battery “life” is usually shorter than people expect, and the spec that matters most is cycle life to 80% capacity (often written as “X cycles to 80%”). The common mistake is sizing a solar backup so the battery deeply cycles every day, then charging it with settings that drift outside what the battery expects. This article breaks down calendar aging vs cycle aging, what changes both, and how to estimate when you should plan replacement.
Solar panel batteries typically last 5 to 15 years for many LiFePO4 setups (calendar aging), while lead-acid often lasts about 3 to 8 years. Cycle life is the limit that matters for daily cycling, and many batteries are rated to 80% capacity after a certain number of cycles. In real homes, depth of discharge and heat drive those numbers down.
How Long Do Solar Panel Batteries Last?
Recommended Products

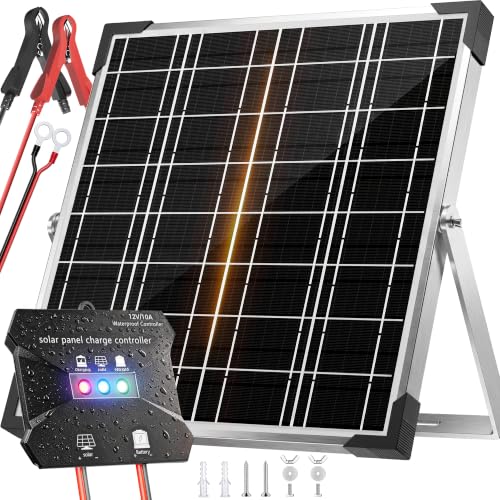
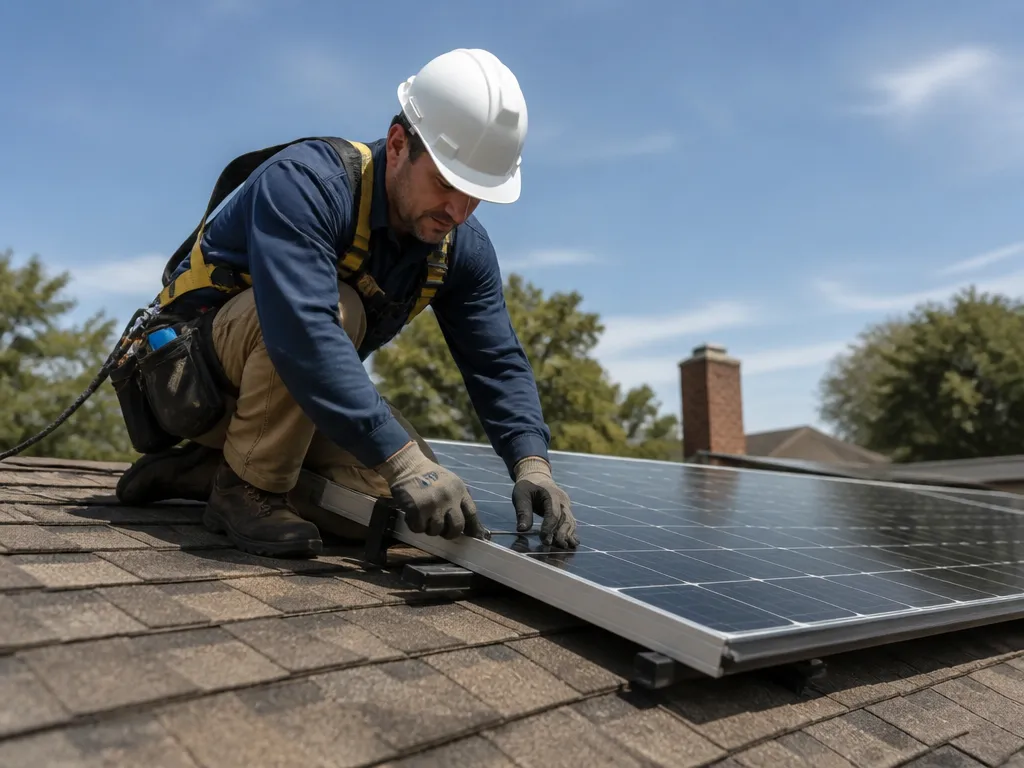
Most solar battery systems are rated for both calendar aging and cycle aging, and typical real-world service life depends heavily on chemistry and how hard you cycle the pack. A common “end of life” reference is when usable capacity drops to about 80% of the original capacity.
Typical lifespan ranges by chemistry look like this, assuming normal system maintenance and staying within manufacturer charge and temperature limits. Lead-acid often improves your value for simple off-grid setups, but it usually has shorter cycle life. Lithium chemistries generally hold up better through repeated cycling, with LiFePO4 often being the most cycle-tolerant option among common solar battery types.
| Battery type | Common use pattern | Typical service life range | Capacity marker |
|---|---|---|---|
| Lead-acid (flooded/AGM) | Infrequent deep cycles to moderate daily cycling | ~3 to 8 years | Often replaced around reduced capacity and rising charge time |
| Li-ion (varies by cathode) | Daily cycling, residential storage | ~5 to 12 years | Frequently tracked to ~80% capacity |
| LiFePO4 (LFP) | Daily cycling, long-term off-grid | ~8 to 15+ years (depends on cycle depth) | Commonly planned replacement at ~80% usable capacity |
Capacity Drop: What “80% End Of Life” Really Means
“End of life” usually means the battery has degraded enough that it no longer delivers the original usable capacity at your normal charge settings and operating temperatures. For solar, that often translates into fewer backup hours, shorter runtime on cloudy days, or more frequent low-voltage cutoffs in inverters.
Capacity typically declines gradually, then more noticeably once you repeatedly cycle the battery deeply. For planning, you can treat the first noticeable drop from full capacity to roughly 80% as the point where you should start forecasting replacement, even if the system still powers loads.
Calendar Life Vs Cycle Life: Why Both Decide Longevity
Calendar life is how fast a battery ages while it sits or stays at elevated state of charge, even if you do not cycle it. Cycle life is how long it survives repeated charge and discharge, which is why daily cycling can reduce lifetime even when temperatures are controlled.
Deep discharges (large depth of discharge) and high cycling frequency are the biggest accelerators of cycle aging, while high heat and chronically holding the pack near full charge can accelerate calendar aging.
For example, a system that cycles 300 to 500 times per year is likely to age faster on cycles than a backup-only system that cycles a few dozen times per year.
Practical replacement triggers: plan ahead if you see the usable capacity fall faster than expected, inverter low-voltage cutoffs happening sooner, the battery taking longer to reach full charge, or any warning indicators from the battery management system. Stop using immediately if you notice swelling, strong overheating, burning smells, or physical damage to the pack or cabling.
Calendar Vs Cycle Aging
Recommended Products
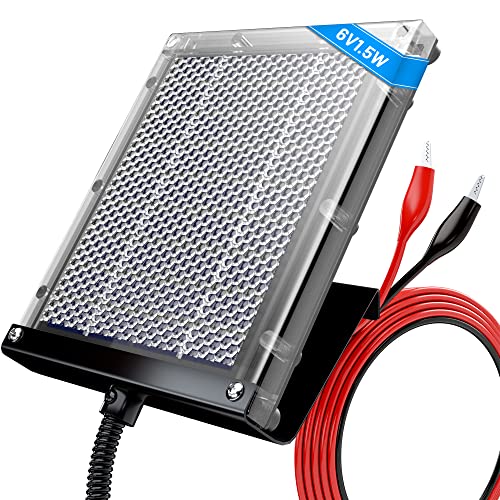

In practice, most off-grid users see both calendar and cycle aging, with usage patterns deciding which dominates.
Calendar Aging: Time, Temperature, And Storage State
Calendar aging is driven by temperature and how long the cells sit near high or low states of charge. Heat speeds chemical reactions inside the cells, so a battery kept in a hot shed or near a poorly ventilated controller ages faster than one stored cool. High average state of charge (often sitting near “full” after long float periods) also increases stress, which can show up as gradual capacity loss long before the battery “fails.”
Calendar aging is why a backup-only battery can still decline over years even with few cycles.
For instance, a battery that spends months at a high charge level during long cloudy seasons may lose runtime even though it never experiences heavy daily cycling. When capacity drops, the system can reach low-voltage cutoffs sooner, so loads run shorter until the battery is replaced or the system is resized.
Cycle Aging: Depth Of Discharge And Charge Throughput
Cycle aging depends on how much energy you remove each time and how many times you do it. Deeper discharges (high depth of discharge) put the cells through more internal stress per cycle, which reduces long-term cycle life. Charge throughput also matters, meaning the total amount of energy charged and discharged over the battery’s life, including partial cycles.
Degradation looks like capacity loss and higher internal resistance. Capacity loss is the most visible symptom, where runtime shrinks and the inverter or controller reaches cutoff at higher remaining percentage. Rising internal resistance causes more voltage sag under load, so power cutoffs happen sooner even at similar displayed charge levels.
For reliability planning, treat “end of life” as the point when the battery can no longer support your loads with acceptable margins. When you see repeated cutoff events or the runtime drops enough that daily routines fail, schedule testing and replacement planning rather than waiting for a total failure. A healthy system should not need perfect weather to operate reliably, so frequent low-voltage cutoffs are an early warning that the battery has aged beyond your use case.
Lifespan By Battery Chemistry
Recommended Products

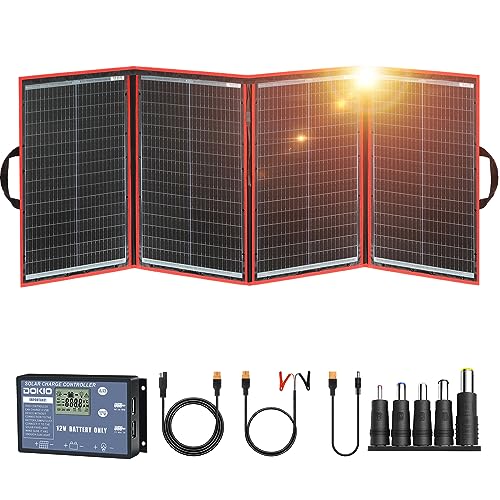
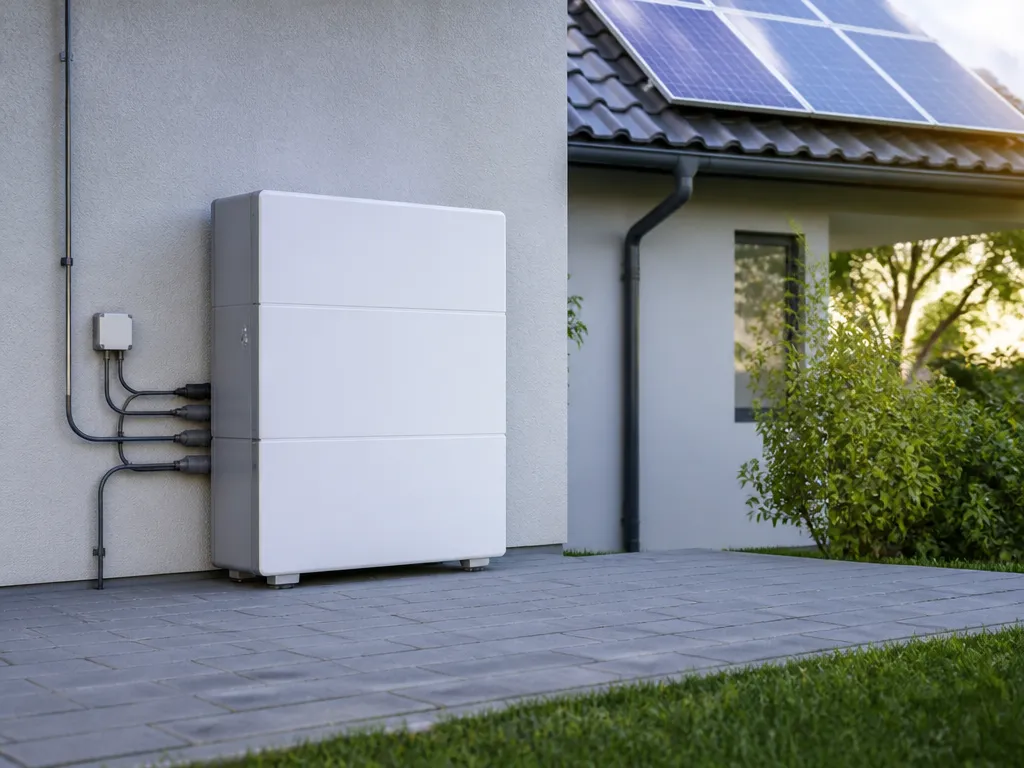
Solar storage longevity depends more on calendar time and how deeply the pack is cycled than on “solar panels versus grid.” Typical residential battery life is often quoted either as years to a capacity threshold (commonly 80%) or as cycles to that same threshold, so the same battery can “last” different lengths depending on daily use.
LiFePO4 (LFP) packs usually show the most stable cycle aging. Real-world strengths include good tolerance to frequent cycling and reduced risk of thermal runaway compared with many lithium chemistries, but realistic failure modes still happen: loss of capacity from repeated high-temperature cycling, BMS limitations or early trips that reduce usable capacity, and physical aging of cells plus contact wear inside the pack.
Li-ion (NMC, NCA, and similar) packs generally deliver higher energy density than LFP, which helps system size, but aging can be more sensitive to heat and charging conditions. Common patterns include gradual capacity loss tied to time spent at high state of charge (SOC), faster degradation from frequent deep cycling, and higher stress from elevated charge voltages or poor thermal management (especially in compact enclosures).
Lead-acid (flooded, AGM, Gel) trades lower cost and simpler charging concepts for shorter cycle life when used hard. Lead-acid aging is often dominated by sulfation from being left at low SOC, plate corrosion from overcharging, and water loss (flooded) or venting and dry-out (AGM/Gel). Calendar aging also matters, because lead-acid still ages when stored warm or at partial charge.
| Battery chemistry | How lifespan is usually quoted | Common wear pattern | Real failure modes near end-of-life |
|---|---|---|---|
| LiFePO4 (LFP) | Cycles to 80% capacity and calendar rating (varies by manufacturer) | Capacity fade from temperature, time at high SOC, charge/discharge stress | BMS derating or trips, gradual capacity loss, accelerated wear if kept hot |
| Li-ion (NMC/NCA variants) | Cycles to 80% plus calendar years (often strongly tied to test conditions) | More sensitivity to heat and time at high SOC | Capacity loss that reduces usable runtime, performance drop under load, BMS limits |
| Lead-acid (flooded/AGM/Gel) | Cycles to a target and calendar life (SOC history is critical) | Sulfation when stored or left partially charged, corrosion from overcharge | Higher self-discharge, voltage sag under load, irreversible sulfation |
What to verify on the specific datasheet or warranty is straightforward: find the stated “end of life” threshold (often 80% remaining capacity) and the test definition behind cycle life, including DoD (depth of discharge), charge voltage, temperature, and whether cycling is daily. Also look for a calendar rating that states the assumed operating temperature band, since a pack kept warm can reach the threshold years earlier than the same pack used cool.
For example, a cycle-life spec of “cycles to 80%” might assume a certain DoD (like partial cycling) and a particular temperature range. Converting that to years is rough because a household battery might cycle once per day, multiple times per day, or sit at high SOC for days during cloudy stretches, each of which changes the path to the 80% point.
For example, a battery that reaches 80% after a fixed number of cycles can reach the threshold sooner with deep cycling, colder charging, or frequent high-power loads that push internal heating. A different battery can “look fine” by voltage while quietly losing capacity, so plan replacement around capacity measurements or battery management reports rather than only using full-charge voltage as a health gauge.
Replacement planning trigger signs are usually capacity-related, plus behavior changes: noticeable loss of runtime, earlier-than-expected cutoff under the same inverter load, rising charge time to reach “full,” and increased imbalance warnings (lithium) or persistent low voltage after charging (lead-acid). Swollen housings, strong heat, or damaged wiring mean stop using the system and investigate immediately, since end-of-life can look like a safety event.
Variables That Shorten Lifespan
Recommended Products


Solar systems add predictable stressors, especially deep daily cycling, heat, and charge settings that keep the battery near full state for long periods.
Depth Of Discharge (Dod) And “Usable” Energy
Deeper discharge uses more of the battery’s active material each cycle, so it costs more life. For lead-acid chemistries, going from a higher state of charge down further (for example, running closer to empty) increases sulfation risk during the next rest and charging phase.
For lithium packs with battery management, deep discharge still increases wear because it drives stronger internal cycling and more time spent at voltage extremes. The practical takeaway is to size the system so daily loads finish at a comfortable remaining charge, ideally with a wide buffer.
Cycles Per Day And Daily Cycling Pattern
Frequent partial cycles usually age cells faster than fewer, deeper cycles only if they create lots of “micro cycling” around high and mid state of charge. In real solar setups, short cloudy days followed by frequent top-ups can produce many small swings, which is still cycling stress.
Backup-only use can look gentler because the battery idles at a higher state of charge between long standby periods. Off-grid homes that cycle daily, even if they do not reach very low discharge, often see faster capacity decline because the calendar-to-cycle total climbs quickly.
Temperature: Heat, Cold, And Charging Limits
Heat accelerates aging for nearly every battery chemistry by speeding side reactions inside the cells. Cold can be even more damaging when charging continues despite reduced acceptance, because lithium cells can struggle to accept charge safely below certain temperatures, and lead-acid charging behavior changes in cold conditions.
Solar controllers sometimes attempt to keep the system running, but they should still respect battery temperature sensors and charge limits. If the battery sits in an unventilated enclosure, near the inverter, or in sun-heated conditions, it will typically lose capacity faster than the same pack used in a cooler, ventilated location.
Charging Voltage Settings And Charge Termination Behavior
Charge settings are a frequent hidden failure mode in solar systems. Incorrect absorption or float voltage, or a controller that keeps charging too aggressively, increases gassing (lead-acid) or accelerates stress (lithium) by holding cells at high voltage longer.
Charge termination also matters. If the system keeps “topping up” because loads draw again immediately after a charge cycle, the battery spends more time near high state of charge, which reduces long-term capacity retention.
Resting At High State Of Charge (High Soc)
Leaving a battery parked near full for long periods can age it faster than letting it rest at a mid SOC. Solar systems that run loads lightly but quickly restore the battery to near full can create long high-SOC dwell times, especially during extended bright weather.
Some backup setups sit at high SOC while waiting for outages, which can shorten life compared with systems that cycle more regularly but only to moderate depths. The goal is balance: avoid both frequent deep cycling and long-term high-SOC idling.
System Sizing: Mismatched Array, Battery, And Inverter
Undersized solar relative to daily use forces the battery to discharge deeper and longer each day, increasing cycle stress. Oversized PV relative to battery capacity can keep the battery at high SOC more often, which also shortens life, especially if the controller cannot limit charging effectively.
Inverter sizing can worsen the pattern by encouraging short, heavy draws that cause voltage sag and then rapid recharging. Repeated power swings increase cycling events and can stress both the battery and the charger/controller strategy.
Operational Context: Off-grid Cycling Versus Backup-only Idling
Off-grid batteries experience daily cycling and weather-driven variability, so they accumulate wear through frequent charge-discharge even if each cycle is shallow. Backup-only batteries may age mostly through calendar aging and high-SOC idling, especially if the system stays fully charged while waiting for rare events.
Both contexts can reduce lifespan, but they do it through different stress mixes. The fastest way to diagnose the pattern is to check your controller logs (charge/float hours, temperature warnings, and cycle counts) and compare them to the battery’s reported battery management metrics or health estimates.
Cycle-to-years Worked Examples
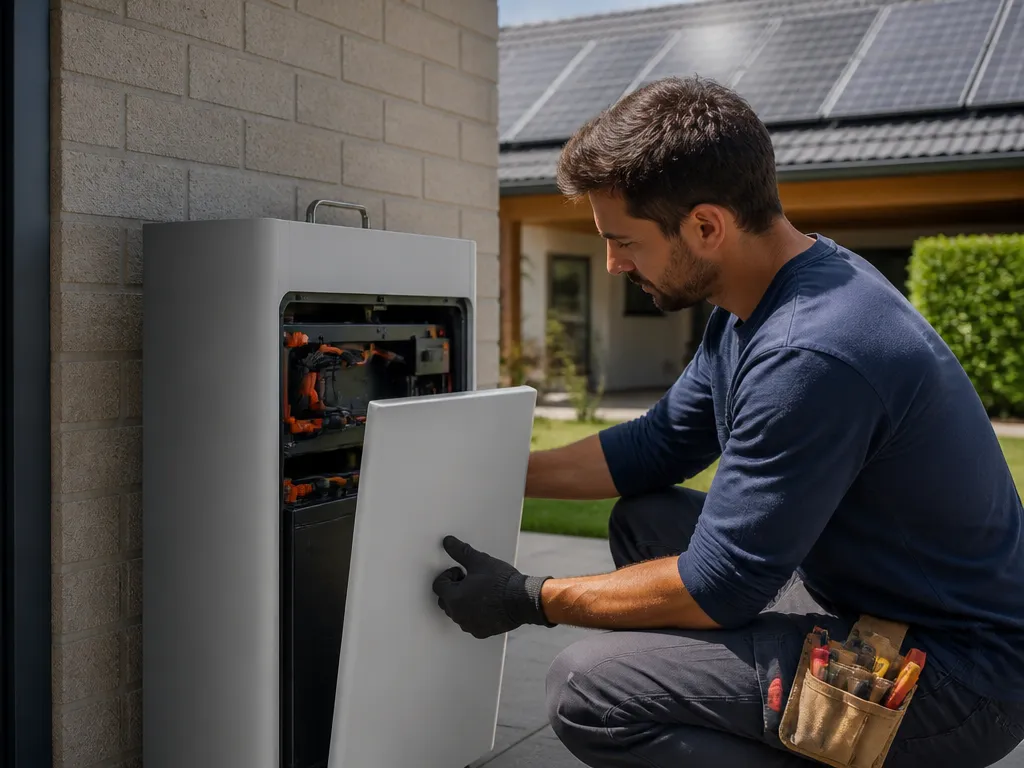
Cycle life turns into calendar life only after you pick a depth of discharge (DoD) and a cycling pattern. Battery datasheets often quote cycle counts to a specific end-of-life point (commonly when capacity drops to 70% to 80%), so the same cell can look “good” for different years depending on how you use it.
Example 1 uses a common household rhythm: daily cycling to about 80% DoD. Here “80% capacity” later means the battery has worn down to about 80% of its original watt-hour capacity, even though it might still keep powering loads in the short term.
Backup-only use changes the math because cycles per day drop sharply, while calendar aging still chips away over time.
| Scenario | Approx. cycling rate | Representative DoD | Cycle-based years to an 80% capacity endpoint (illustration) |
|---|---|---|---|
| Daily cycling | 365 cycles/year | ~80% DoD | 2,000 cycles ÷ 365 ≈ 5.5 years |
| Daily cycling, shallower | 365 cycles/year | ~60% DoD | If life doubles to 4,000 cycles: ≈ 11 years |
| Backup-only | ~12 cycles/year | ~50% to 60% DoD | 2,000 ÷ 12 ≈ 167 years by cycles, but calendar aging dominates |
Rule of thumb for planning: daily cycling is usually where cycle count decides your years, while backup-only use usually shifts the bottleneck to calendar aging and temperature.
Warranty Numbers Decoded
Recommended Products
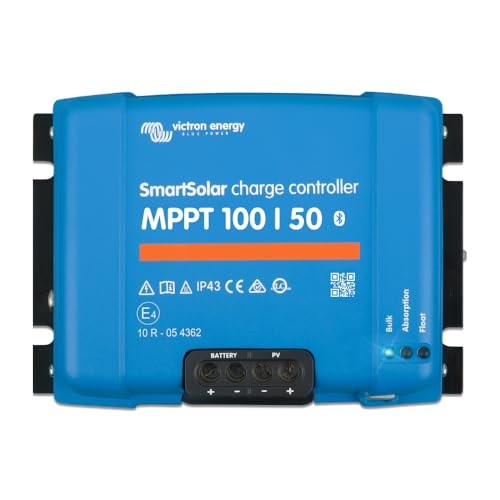

Battery longevity claims usually hide testing assumptions. “X years” often means the pack still meets a capacity target after calendar time under a controlled temperature and charge pattern, while “Y cycles to 80%” assumes repeated cycling with a specific depth of discharge and charge rate.
Solar storage warranties can guide expectations, but only if you match your use to their test conditions. The cycle-life number dominates when you run the system daily or seasonally (more cycles per year), while the calendar-year number dominates when you mostly sit at high state of charge, float for long periods, or experience hot storage.
X Years Vs Y Cycles, Which One Controls Your Outcome
Use the cycle-life figure when your battery regularly goes through meaningful charge and discharge. A typical solar pattern involves partial depth-of-discharge most days, then deeper discharges during cloudy stretches, so the effective “cycles” depend on how far the battery drops each time (depth of discharge) and how often you do it.
Use the calendar-year figure when your pack is kept near full charge for long durations or stored warm. Many lithium systems are sensitive to heat and sustained high state-of-charge, so the “years” warranty can shorten in real installations even if the daily cycling is mild.
Warranty Wording To Watch (What Actually Makes The Claim Valid)
Warranty language often includes eligibility hoops that affect how long you can expect, even after the pack starts declining. Look for requirements around permitted usage (backup-only versus daily cycling), monitoring (app logs or BMS reports), and environmental limits (temperature and ventilation).
Warranty statements also include exclusions that can erase coverage during common solar scenarios. Pay attention to damage caused by overheating, water ingress, modifications, or operation outside the manufacturer’s charging parameters.
| Warranty wording pattern | What it usually means for real-world life |
|---|---|
| “X years or Y cycles, whichever occurs first” | Expect the earlier limit to govern for your use intensity. Daily cycling pushes you toward the cycle count. |
| “To 80% capacity under stated conditions” | You must match the test assumptions (temperature, DoD, charge rate). Real conditions can change the endpoint. |
| “Monitoring required” or “use documented settings” | The system may need to log BMS data and charger behavior. Firmware or settings outside spec can reduce coverage. |
| “Excludes damage from improper charging” | Using a solar charge controller or charger configuration outside the approved voltage/current strategy can void the claim. |
Practical takeaway: Treat “X years” and “Y cycles to 80%” as two different test worlds. Pick the one closer to your daily reality, then confirm you can meet the assumptions on DoD, temperature, and charge profile, because warranty math is conditional.
Plan replacement around capacity loss thresholds, not just the warranty end date. If your system begins running longer than expected to deliver the same loads, or your state-of-charge behavior looks “sticky” (charge seems to recover less than before), the battery may be transitioning out of the range your warranty target assumed.
End-of-life Signs And Checks
Solar panel batteries usually give warning before they fail, most often through reduced usable capacity and the battery management system (BMS) limiting charge and discharge. End-of-life also shows up physically as heat, swelling, odor, or corrosion around terminals, especially after repeated heavy cycling. Treat both performance symptoms and safety signs as reasons to inspect and plan service, not just to “try a new charger.”
Performance Clues To Watch Daily
Reduced usable capacity is the most common early symptom. A battery that used to run a fridge, lights, and a router for a predictable window starts cutting out sooner at the same loads, even after the system reaches full charge. In inverter systems, you may also see higher frequency low-voltage cutouts or shortened run time during cloudy stretches.
In practice, compare behavior week to week under the same conditions (same loads, similar weather, similar state-of-charge at start).
For example, if your loads draw the same watts but you get less time, the battery has likely lost capacity, the BMS has tightened limits, or the charge path has a resistance problem. If runtime drops fast after an environment change, check for loose connections and temperature effects before assuming permanent loss.
Bms Warnings And Fault Codes
BMS screens and app dashboards often give clearer signals than runtime guessing. Battery systems that have lithium cells commonly report capacity estimates, health percent, and cycle counts, plus fault codes for over-temperature, over-voltage, under-voltage, or cell imbalance. When the BMS starts imposing lower charge/discharge limits, usable energy can fall even before the pack feels “dead.”
BMS warnings also help distinguish a capacity problem from a charging problem. A “cell imbalance” or “charge limit reached” message suggests the pack needs balancing or service, while “charging disabled” due to temperature points to the operating environment or a sensor issue. If you see repeated faults, record the exact message text and any timestamps, then plan troubleshooting in the next steps.
Safe Capacity Verification Homeowners Can Do
Home tests should be about observing the system, not disassembling or forcing currents. The safest check is a controlled discharge measurement using your existing inverter or load, while watching the battery’s reported state-of-charge and the inverter’s cutout behavior. Use the same load watts and stop when the inverter reaches its normal low-voltage cutoff, then compare how long you get.
For lead-acid systems, some owners use a simple load test to see voltage under load, but follow the manufacturer’s procedure since voltage relaxation and battery type matter. For lithium packs, avoid any procedure that bypasses the BMS. If the battery is integrated into a solar generator or wall cabinet, the safest “test” is reading the health metrics through the app or controller and documenting trends.
Inspection Triggers That Mean “Stop And Plan Replacement”
Heat, swelling, odor, and corrosion are end-of-life safety triggers, not normal wear. A battery case that bulges, vents, or smells “sweet,” “solvent-like,” or “hot-electronics” is a red flag. Loose cables, whitening at terminals, and visible rust or green corrosion are also signs that internal resistance is rising and the pack can fail unpredictably.
System hardware also matters. Bent or loosened terminals, damaged insulation, frayed cables near the battery, or a noticeable change in ventilation behavior (blocked vents, missing airflow) can accelerate aging or trigger BMS temperature protection. When these signs appear, prioritize safe handling and professional inspection over further cycling tests.
When To Troubleshoot First Versus Schedule Service
Capacity loss is often gradual, while configuration and wiring issues can create sudden changes. Plan replacement when multiple indicators agree, such as sustained runtime drop plus BMS health/capacity estimates trending down, or repeated under-voltage cutouts at loads that used to work. Plan service when safety signs appear, or when the BMS repeatedly logs imbalance or temperature faults that you cannot resolve by checking airflow and settings.
Start with troubleshooting first when the symptoms look charger-specific. For example, runtime is normal on one input but short on another, or the battery reaches full by the charger yet the inverter immediately reports low state-of-charge. In those cases, the safer path is checking charger output, cable condition, connection tightness, and controller settings before assuming the cells have permanently aged.
| Observed pattern | Most likely direction | Action priority |
|---|---|---|
| Runtime falls across weeks, BMS health % declines | Capacity aging | Plan replacement |
| Repeated over-temp faults with poor ventilation | Environmental or sensor issue, accelerated aging risk | Check cooling and schedule service if it returns |
| Corrosion or loose terminals, intermittent charging | High resistance connection | Repair connections, then reassess |
| Charger reports full, inverter behaves empty | Charge path mismatch or BMS limit behavior | Troubleshoot settings and connections first |
Max Lifespan Settings And Habits
Calendar life typically runs 5 – 15 years, while cycle life ranges from hundreds to thousands of cycles.
Chemistry profiles matter for longevity. LiFePO4 commonly reaches 10 – 15 years or 2,000 – 5,000 cycles at modest DoD, while NMC chemistries run 8 – 12 years and 1,000 – 2,000 cycles; flooded lead-acid often delivers 5 – 10 years with 500 – 1,000 cycles.
| Chemistry | Typical calendar life | Typical cycle life (80% DoD) | Notes |
|---|---|---|---|
| LiFePO4 | 10 – 15 years | 2,000 – 5,000 cycles | Stable chemistry with long life under proper care |
| Li-Ion (NMC/LiNiCoMn) | 8 – 12 years | 1,000 – 2,000 cycles | Higher energy density, voltage sensitivity requires management |
| Flooded Lead-Acid | 5 – 10 years | 500 – 1,000 cycles | Lower cost, more maintenance; sensitive to DoD |
| AGM/Sealed Lead-Acid | 4 – 8 years | 300 – 800 cycles | Compact and robust but higher self-discharge |
Daily cycling versus backup use changes aging dynamics. Regular cycling with a modest DoD preserves usable life, but high DoD or frequent full charges accelerate wear. Backup-only operation can preserve calendar life, yet aging from constant storage and occasional reactivation still occurs.
Signs you are nearing end of life include capacity dropping toward 80% of the original rating, rising internal resistance, and voltage sag under load. Swelling, overheating, or persistent BMS faults also indicate replacement is prudent.
Temperature management matters. Proper ventilation, insulation against heat waves, and placement away from heat sources extend life more than any single setting.
For long idle periods, store at a mid-range SOC and check every few months to top up if needed. Idle strategies that avoid extremes reduce aging while keeping batteries ready for backup.
In practice, a LiFePO4 pack rated for 2,000 cycles at 80% DoD will typically deliver about 8 – 12 years under daily cycling, while backup-only use could push toward 12 – 15 years if DoD remains low. If you cycle roughly once per day, 2,000 cycles equate to about 5 – 6 years, with longer horizons possible at slower cycling rates.
Plan replacement when capacity dips to about 80% of the original rating or when performance no longer meets essential backup needs. Keeping a simple fade log and tracking cycle counts helps you schedule replacements before critical failure.
Quick Summary
Use the battery’s cycle rating, calendar rating, DoD, temperature limits, and charge settings together when estimating replacement timing. Falling runtime, earlier cutoffs, longer charging, and persistent BMS warnings are practical signs that capacity has declined toward the battery’s end-of-life threshold.
Frequently Asked Questions
How Do I Determine If A Solar Panel Battery Storage Is Compatible With My Solar Panel System And Inverter?
To check compatibility, ensure the battery bank voltage matches your charge controller and inverter input, typically 12 V, 24 V, or 48 V, and that the max charge current does not exceed the controller rating. Also verify the chemistry is supported by your system. Matching voltage and current specs is the single most important compatibility check.
Can High Temperatures Affect Solar Panel Battery Lifespan And Performance?
Yes. Heat accelerates chemical aging and can reduce capacity and cycle life, especially for lead-acid types. Most batteries list an operating range up to about 40 to 45°C; sustained higher temps shorten life and lower efficiency. Keep the battery in a ventilated, shaded area to stay within the recommended range.
How Long Can A Solar Panel Battery Provide Runtime For Typical Loads, And What Factors Affect It?
Runtime depends on capacity in watt-hours and the load in watts. For example, a 1000 Wh (1 kWh) battery powering a 100 W load can run for about 10 hours in ideal conditions; real-world runtimes are often 7 – 9 hours due to inverter losses and temperature. Actual runtime = usable Wh divided by load W, adjusted for efficiency.
What Safety Precautions Should I Take To Prevent Overheating Or Gas Buildup In Solar Panel Batteries?
Always use a charge controller with the correct voltage and current limits and keep the battery in a well ventilated area. Avoid charging in a sealed cabinet, especially with flooded lead-acid, because hydrogen gas can build up. Ventilation is mandatory for flooded batteries to prevent gas buildup.
When Should I Replace A Solar Panel Battery, And What Buying Mistakes Should I Avoid To Maximize Lifespan?
Replace when capacity falls to about 80% of the original rating or when the warranty signals end of life. When buying, common mistakes include choosing a cheap brand, ignoring discharge limits, and overlooking compatibility. Choose a battery with a solid warranty and verified compatibility for your system.

- 10 Best Battery For Generator Battery Safety System 2026 - October 12, 2026
- 10 Best Battery For Generator Battery Safety Option 2026 - October 12, 2026
- 10 Best Battery For Generator Battery Safety 2026 - October 12, 2026